What Is CSAT, NPS, and CES? A Guide to Customer Service Metrics
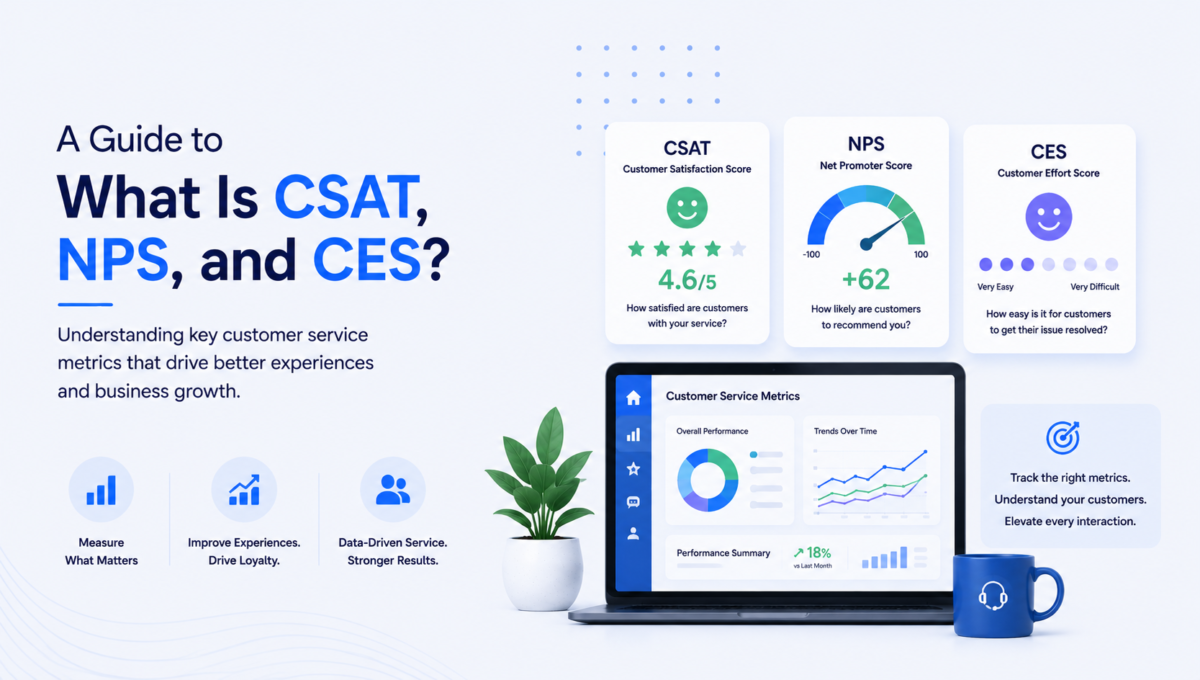
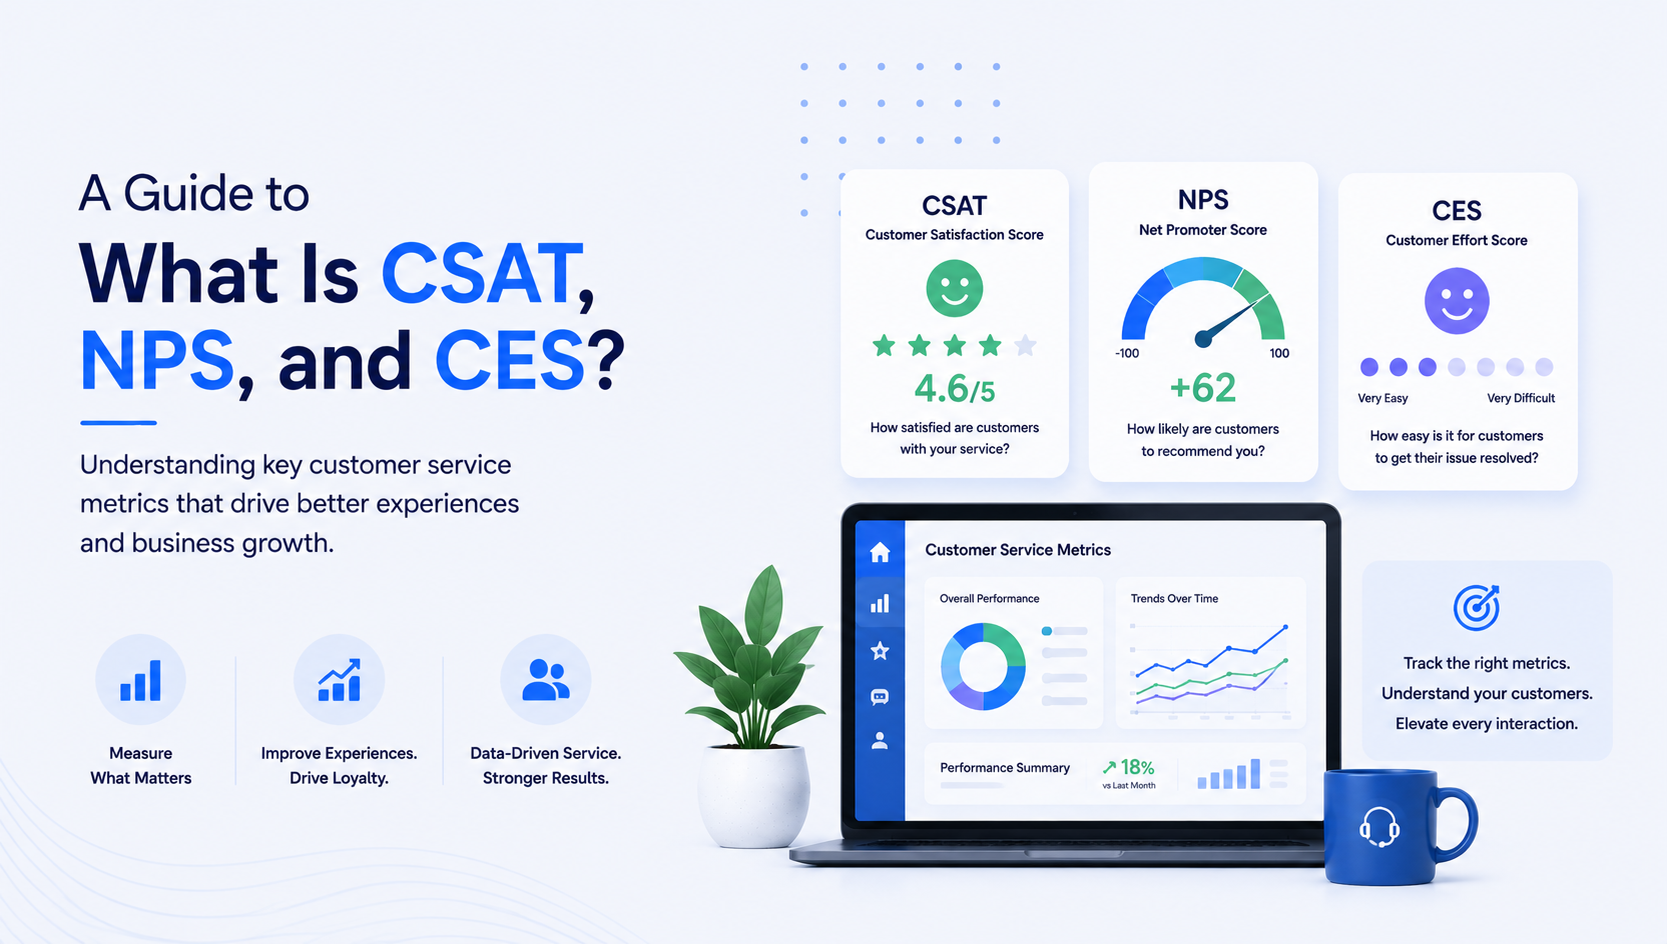
CSAT, NPS, and CES are the three most widely used customer experience metrics, and each measures something different. CSAT (Customer Satisfaction Score) measures how satisfied a customer is with a specific interaction or product. NPS (Net Promoter Score) measures long-term loyalty by asking how likely a customer is to recommend you. CES (Customer Effort Score) measures how easy it was for a customer to get something done, such as resolving a support issue. CSAT and CES are transactional (tied to a single touchpoint), while NPS is relational (tied to the overall relationship). Most strong customer experience programs use a combination of all three rather than relying on one. This guide explains what each metric is, how to calculate it, and when to use which.
Key Takeaways
- CSAT measures satisfaction with a specific interaction; NPS measures overall loyalty and likelihood to recommend; CES measures how much effort an interaction required.
- CSAT and CES are transactional (touchpoint-level); NPS is relational (relationship-level).
- The formulas differ: CSAT is a percentage of satisfied responses, NPS is promoters minus detractors, and CES is an average ease rating.
- No single metric tells the whole story — the best programs combine them across the customer journey.
- Always interpret each metric against context and trend over time rather than a one-off number.
CSAT vs NPS vs CES at a Glance
| CSAT | NPS | CES | |
|---|---|---|---|
| Measures | Satisfaction with a specific interaction or product | Long-term loyalty and likelihood to recommend | How easy it was to complete an interaction |
| Question | “How satisfied were you?” | “How likely are you to recommend us?” | “How easy was it to resolve your issue?” |
| Type | Transactional (or relational) | Relational | Transactional |
| Scale | 1–5 or 1–10 | 0–10 (score ranges −100 to +100) | Typically 1–7 (or 1–5) |
| Best for | Spotting issues right after a touchpoint | Tracking overall brand health and loyalty | Reducing friction in support and processes |
What Is CSAT (Customer Satisfaction Score)?
CSAT measures how satisfied a customer is with a specific interaction, product, or service. It’s one of the most widely used and straightforward customer experience metrics because it captures sentiment immediately after a touchpoint — making it ideal for spotting problems and confirming wins in real time.
The CSAT question is simply some version of “How satisfied were you with your experience?”, answered on a scale (commonly 1–5 or 1–10), where higher numbers mean greater satisfaction.
How to calculate CSAT:
CSAT (%) = (Number of satisfied responses ÷ Total responses) × 100
Satisfied responses are usually the top ratings (a 4 or 5 on a 5-point scale). For example, if 80 of 100 respondents rate their experience a 4 or 5, your CSAT is 80%.
CSAT works best immediately after specific interactions — a resolved ticket, a completed purchase, a support call — while impressions are fresh. Its strength is simplicity and immediacy; its limitation is that it reflects short-term sentiment and doesn’t always predict long-term loyalty.
What Is NPS (Net Promoter Score)?
NPS measures customer loyalty and the likelihood that customers will recommend your company — a relational metric that tracks overall brand health rather than a single interaction. It was created by Fred Reichheld at Bain & Company and introduced in his 2003 Harvard Business Review article “The One Number You Need to Grow,” and has since become one of the most widely adopted loyalty metrics in the world.
The NPS question is a single one: “On a scale of 0 to 10, how likely are you to recommend us to a friend or colleague?” Respondents are then grouped:
- Promoters (9–10): loyal enthusiasts who keep buying and refer others.
- Passives (7–8): satisfied but unenthusiastic and vulnerable to competitors.
- Detractors (0–6): unhappy customers who can damage your brand through negative word of mouth.
How to calculate NPS:
NPS = % of Promoters − % of Detractors
The result ranges from −100 (everyone is a detractor) to +100 (everyone is a promoter). For example, if 60% are promoters and 20% are detractors, your NPS is +40. NPS is valued for predicting long-term growth and loyalty, though it’s less granular about specific touchpoints than CSAT or CES.
What Is CES (Customer Effort Score)?
CES measures how easy or difficult it was for a customer to complete an interaction — resolving an issue, getting support, or finding an answer. It’s based on a well-supported principle: reducing customer effort and friction is a strong driver of loyalty. CES was introduced by Gartner (through its CEB research) around 2010, making it the newest of the three metrics.
The CES question asks customers to rate ease, for example “How easy was it to resolve your issue?”, on a scale (commonly 1–7, sometimes 1–5).
How to calculate CES:
CES = the average of all ease ratings
A higher average indicates a smoother, lower-effort experience. CES is especially useful right after support interactions and self-service experiences, because it pinpoints exactly where friction exists. Its main limitation is that, as a newer metric, benchmarking is less mature — so your own trend over time matters more than comparison to a universal standard.
Transactional vs Relational Metrics
A useful way to understand these metrics is by what they’re tied to:
- Transactional metrics capture feedback about a single touchpoint, sent right after an interaction. CES is purely transactional, and CSAT is usually used transactionally.
- Relational metrics capture feedback about the overall relationship, sent periodically. NPS is primarily relational.
This is why they work well together: transactional metrics (CSAT, CES) tell you how individual interactions are going, while a relational metric (NPS) tells you whether those interactions are adding up to genuine loyalty over time.
When to Use CSAT vs NPS vs CES
Choose the metric that matches your goal:
- Use CSAT when you want to measure satisfaction with a specific interaction or purchase — ideal right after a ticket closes, a call ends, or a product is delivered.
- Use NPS when you want to gauge overall loyalty and brand health, and predict long-term growth and word-of-mouth referral.
- Use CES when you want to find and remove friction in support or self-service, since a low score points directly to where customers are struggling.
In practice, many teams use more than one. A common approach is to track CSAT and CES after individual interactions to monitor quality and ease, then run NPS surveys periodically to see whether those improvements are translating into loyalty. Combined, the three give a fuller picture of the customer experience than any one alone.
How These Metrics Connect to Call Center Performance
For a contact center, these CX metrics sit alongside operational metrics like Average Handle Time (AHT) and First Call Resolution (FCR) to form a balanced view of performance. Efficiency metrics tell you how the center runs; CSAT, NPS, and CES tell you how customers feel about the result. The strongest operations track both together — for instance, watching that a push to reduce average handle time doesn’t quietly drag down CSAT, and that high first call resolution shows up as lower customer effort. Our guide to call center quality assurance covers how these measures feed a complete scorecard.
How Octopus Tech Uses Customer Experience Metrics
Octopus Tech has delivered outsourced call center services from India since 2011, with a focus on measuring what matters to the client’s customers — not just operational speed. Tracking satisfaction, loyalty, and effort alongside efficiency metrics is what allows an outsourcing partner to improve the actual customer experience rather than just the numbers on a dashboard. If you’re evaluating how a partner reports and acts on performance data, our guide on how to choose a call center outsourcing partner covers the questions to ask.
Frequently Asked Questions
What is the difference between CSAT, NPS, and CES?
CSAT measures satisfaction with a specific interaction, NPS measures overall loyalty and likelihood to recommend, and CES measures how easy an interaction was. CSAT and CES are transactional (tied to a single touchpoint), while NPS is relational (tied to the overall relationship), so each answers a different question about the customer experience.
How is CSAT calculated?
CSAT is calculated as the number of satisfied responses divided by total responses, multiplied by 100. Satisfied responses are typically the top ratings (a 4 or 5 on a 5-point scale). For example, if 80 of 100 respondents rate their experience 4 or 5, the CSAT score is 80%.
How is NPS calculated?
NPS is the percentage of promoters (customers who rate 9–10) minus the percentage of detractors (those who rate 0–6), based on the question “How likely are you to recommend us?” The score ranges from −100 to +100. For example, 60% promoters minus 20% detractors gives an NPS of +40.
How is CES calculated?
CES is the average of all customers’ ease ratings, usually collected on a 1–7 scale in response to a question like “How easy was it to resolve your issue?” A higher average reflects a lower-effort, smoother experience. Because CES is a newer metric, tracking your own trend over time is more meaningful than comparing to a universal benchmark.
Which customer experience metric is best?
There is no single best metric — each measures a different thing. Use CSAT for satisfaction with specific interactions, NPS for overall loyalty and growth prediction, and CES for identifying friction. Most strong CX programs combine all three across the customer journey to get a complete picture.
Should I use CSAT, NPS, and CES together?
Yes. They complement each other: CSAT and CES (transactional) reveal how individual interactions are performing, while NPS (relational) shows whether those interactions build long-term loyalty. A common approach is to measure CSAT and CES after interactions and run NPS periodically to track overall relationship health.
Who created the Net Promoter Score?
NPS was created by Fred Reichheld, a Bain & Company fellow, and introduced in his December 2003 Harvard Business Review article “The One Number You Need to Grow.” It was developed in collaboration with Bain & Company and Satmetrix and has since become one of the most widely used customer loyalty metrics worldwide.
Measuring What Matters in Customer Experience
CSAT, NPS, and CES each illuminate a different dimension of the customer experience — satisfaction, loyalty, and effort — and the smartest approach is rarely to pick just one. Used together and tracked over time, they reveal not only how customers feel about individual interactions but whether those interactions are building the loyalty that drives growth. For contact centers, pairing these CX metrics with operational measures like AHT and FCR gives the complete picture of both how the operation runs and how customers experience it.
Octopus Tech provides outsourced call center services from India built around measuring and improving the metrics that matter to your customers. If you’d like to discuss a metrics-driven approach to customer support, get in touch for a no-obligation conversation.